 Post Reply
8181-8200 of 10484
Post Reply
8181-8200 of 10484
Hi Richtan/Bintan
Tks for your sharing of this VERY interesting info. :)
richtan ( Date: 27-Sep-2009 17:17) Posted:
|
Hi Bintang,
Many thanks for sharing this indicator, which unfortunately is not available in chart nexus (is this in your metastock?)
Anyway, just to share about aroon indicator (very cheem, dun really understand their explanation, but fortunately, chartnexus has "ADX" (also trending up n above 20 with +DI above -DI:
Aroon Indicator
What Does Aroon Indicator Mean?
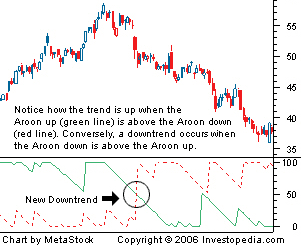
A technical indicator, developed by Tushar Chande in 1995, used for identifying trends in an underlying security and the likelihood that the trends will reverse. It is made up of two lines: one line is called "Aroon up", which measures the strength of the uptrend, and the other line is called "Aroon down", which measures the downtrend. The indicator reports the time it is taking for the price to reach, from a starting point, the highest and lowest points over a given time period, each reported as a percentage of total time. Both the Aroon up and the Aroon down fluctuate between zero and 100, with values close to 100 indicating a strong trend, and zero indicating a weak trend. The lower the Aroon up, the weaker the uptrend and the stronger the downtrend, and vice versa. The main assumption underlying this indicator is that a stock's price will close at record highs in an uptrend, and record lows in a downtrend.
Investopedia explains Aroon Indicator
For example, when a stock's closing price is equal to the highest price over the given period, the Aroon up will have a value of 100, which indicates that the time it has taken for the stock to reach its highest price has elapsed 100%, indicating a strong uptrend. In addition to extreme values, transaction decisions can be based on instances when the two lines cross. For example, when the Aroon up crosses up through the Aroon down, the stock is said to be in a new uptrend and should experience some upward momentum.
This indicator is very similar to the directional movement index (DMI) that was developed by Welles Wilder, which is also a very popular indicator used to measure the strength of a given trend.
Investopedia explains Directional Movement Index - DMI
The scale for the DMI is from 0 to 100. The average directional movement index (ADX) is a moving average of the DMI.
Bintang ( Date: 27-Sep-2009 10:58) Posted:
| Although Midas did not close above 90 cents on Friday , it did not derail the upward trend . By checking its monthly chart , the Aroon Up is at 100 , n the Aroon Down is at 21 , this indicates that the uptrend has just started from here . The same thing happened in 2006 , during the last bull run , the Aroon Up went up to 100 at Dec2005 n lasted for almost 3 years then went down to cross the Aroon Down in Mar2008, then the uptrend came to an end . Therefore , Midas long term uptrend may start from this month . ( Last bull run , Midas started from 36 cents n went all the way to $2.20 according to Aroon Up n Down .) |
|
|
|
Hi Bintang,
Many thanks for sharing this indicator, which unfortunately is not available in chart nexus (is this in your metastock?)
Anyway, just to share about aroon indicator (very cheem, dun really understand their explanation, but fortunately, chartnexus has "ADX" (also trending up n above 20 with +DI above -DI:
Aroon Indicator
What Does Aroon Indicator Mean?
A technical indicator, developed by Tushar Chande in 1995, used for identifying trends in an underlying security and the likelihood that the trends will reverse. It is made up of two lines: one line is called "Aroon up", which measures the strength of the uptrend, and the other line is called "Aroon down", which measures the downtrend. The indicator reports the time it is taking for the price to reach, from a starting point, the highest and lowest points over a given time period, each reported as a percentage of total time. Both the Aroon up and the Aroon down fluctuate between zero and 100, with values close to 100 indicating a strong trend, and zero indicating a weak trend. The lower the Aroon up, the weaker the uptrend and the stronger the downtrend, and vice versa. The main assumption underlying this indicator is that a stock's price will close at record highs in an uptrend, and record lows in a downtrend.
Investopedia explains Aroon Indicator
For example, when a stock's closing price is equal to the highest price over the given period, the Aroon up will have a value of 100, which indicates that the time it has taken for the stock to reach its highest price has elapsed 100%, indicating a strong uptrend. In addition to extreme values, transaction decisions can be based on instances when the two lines cross. For example, when the Aroon up crosses up through the Aroon down, the stock is said to be in a new uptrend and should experience some upward momentum.
This indicator is very similar to the directional movement index (DMI) that was developed by Welles Wilder, which is also a very popular indicator used to measure the strength of a given trend.
Investopedia explains Directional Movement Index - DMI
The scale for the DMI is from 0 to 100. The average directional movement index (ADX) is a moving average of the DMI.
Bintang ( Date: 27-Sep-2009 10:58) Posted:
| Although Midas did not close above 90 cents on Friday , it did not derail the upward trend . By checking its monthly chart , the Aroon Up is at 100 , n the Aroon Down is at 21 , this indicates that the uptrend has just started from here . The same thing happened in 2006 , during the last bull run , the Aroon Up went up to 100 at Dec2005 n lasted for almost 3 years then went down to cross the Aroon Down in Mar2008, then the uptrend came to an end . Therefore , Midas long term uptrend may start from this month . ( Last bull run , Midas started from 36 cents n went all the way to $2.20 according to Aroon Up n Down .) |
|
AKAN-DATANG...
... short term target 1.20
Although Midas did not close above 90 cents on Friday , it did not derail the upward trend . By checking its monthly chart , the Aroon Up is at 100 , n the Aroon Down is at 21 , this indicates that the uptrend has just started from here . The same thing happened in 2006 , during the last bull run , the Aroon Up went up to 100 at Dec2005 n lasted for almost 3 years then went down to cross the Aroon Down in Mar2008, then the uptrend came to an end . Therefore , Midas long term uptrend may start from this month . ( Last bull run , Midas started from 36 cents n went all the way to $2.20 according to Aroon Up n Down .)
It seems like the rotational play are China counters now. All will cheong if dual listing can uplift the price. Let's wait and see Ozee and Sapphire.
richtan ( Date: 25-Sep-2009 19:28) Posted:
"Trade Summary" at closing shows heavy buying-up (almost doubled the sell-down) with most trades done at 0.905, but of course, nothing is guaranteed, may change, so dyodd n BOSAYOR:
| WEIGHTED AVG PRICE : 0.9003 |
LAST DONE PRICE : 0.895 |
| SPREAD/PRICE RATIO : 0.0056 |
AVG TRADE SIZE : 25.67 |
|
|
|
|
"Trade Summary" at closing shows heavy buying-up (almost doubled the sell-down) with most trades done at 0.905, but of course, nothing is guaranteed, may change, so dyodd n BOSAYOR:
| WEIGHTED AVG PRICE : 0.9003 |
LAST DONE PRICE : 0.895 |
| SPREAD/PRICE RATIO : 0.0056 |
AVG TRADE SIZE : 25.67 |
|
|
G20 Takes Center Stage in New World Order The Group of 20 rich and developing countries
were set to anoint themselves as caretakers of the global economy on
Friday, giving rising stars such as China and India more say in world
affairs.
Heading
into their second day of meetings aimed at assuring the economy emerges
from a deep global recession with better safeguards against another
financial crisis, the G20 pledged to keep emergency economic supports
in place until recovery is secured, according to a draft communique
obtained by Reuters.
likely to push DOW JONE Cross 10000
Buddy Shall we finish the queue @ 0.91?

Very interesting "tug-of-war" between the black mice n white mice when the giant doze-off again.
When the giant wakes up again, they will again go into hiding except for a few adventurous "no scared die one".
"Trade Summary" at this point in time shows extremely heavy buying-up, but of course, nothing is guaranteed, may change, so dyodd n BOSAYOR:
| WEIGHTED AVG PRICE : 0.8990 |
LAST DONE PRICE : 0.910 |
| SPREAD/PRICE RATIO : 0.0055 |
AVG TRADE SIZE : 32.827 |
|
|
ya.. hope Midas will wake up soon ;p
richtan ( Date: 25-Sep-2009 11:59) Posted:
When the giant wakes up (like Wed), the mice will go into hiding again
richtan ( Date: 25-Sep-2009 11:35) Posted:
| When the giant is taking a nap, the mice comes out to play |
|
|
|
| When the giant is taking a nap, the mice comes out to play |
ozone2002 ( Date: 25-Sep-2009 11:32) Posted:
|
midas sleeping again..
Game of mouse and cats - In this game you move the mouse to cross the river and take the cheese. There are pieces of logs flowing through the river and you can cross the river by jumping onto the logs. Beware not to fall into water and move away from the cat.
Looks like not easy for the mouse to have the cheese for it has to jump onto the logs after logs. Poor mouse. richtan ( Date: 25-Sep-2009 11:17) Posted:
| When the cat is away, the mouse comes out to play |
|
|
