

M Club " Aerobic Girls 舞 室 保 衛 戰 " (30 Eps)
Carman Lee, Loletta Lee, Angie Cheung, Flora Chan, Elvina Kong, Fennie Yuen, Gloria Yip, Lawrence Ng

Producer Eric Tsang (above) & Joe Chan Wai Koon
Estimated Filming Completion: September

TVB新 剧 《 M Club》 (原 名 《 Aerobic Girls舞 室 保 卫 战 》 )目 前 正 在 香 港 热 拍 。 该 剧 因 汇 集 了 李 丽 珍 、 李 若 彤 、 叶 蕴 仪 及 张 慧 仪 等 久 违 荧 幕 的 前 女 神 级 人 物 而 备 受 外 界 关 注 。
前 日 , 平 均 年 龄 超 过 40岁 的 众 女 主 演 齐 齐 以 学 生 妹 Look现 身 为 新 剧 做 宣 传 , 除 戴 上 爆 炸 头 假 发 外 , 还 涂 上 厚 厚 的 桃 红 胭 脂 , 相 当 出 位 。
而 之 前 被 传 面 和 心 不 和 的 李 丽 珍 和 李 若 彤 , 更 是 揽 肩 合 照 破 传 言 。
info link: http://asianuniverse.net/forums/TVB_NEW_UPCOMING_SERIES_INFO_2013_t952.html

《 情 逆 三 世 缘 》 讲 述 的 是 一 对 恋 人 , 在 三 个 不 同 的 时 代 , 三 分 三 合 , 三 死 三 娶 , 谱 写 了 横 跨 一 千 年 的 凄 美 浪 漫 时 空 恋 曲 。
香 港 警 察 重 案 组 督 察 袁 金 昌 ( 欧 阳 震 华 饰 ) 因 为 一 句 锥 心 的 誓 言 而 错 手 杀 害 了 女 友 杨 夕 雪 ( 关 咏 荷 饰 ) , 就 在 他 悲 痛 欲 绝 之 际 , 灵 魂 却 突 然 出 窍 穿 越 时 空 来 到 了 宋 代 , 并 附 在 了 名 震 天 下 的 开 封 府 尹 包 拯 包 青 天 的 身 上 , 并 遇 到 了 与 杨 夕 雪 长 得 一 模 一 样 的 韩 霜 霜 。
身 为 公 主 的 韩 霜 霜 却 遭 受 奸 人 高 继 安 ( 黄 智 贤 饰 ) 所 害 , 迫 使 包 拯 不 得 不 泪 斩 霜 霜 , 同 时 灵 魂 再 次 出 窍 到 了 五 六 十 年 代 , 并 成 为 叱 咤 一 时 的 华 龙 飙 探 员 , 与 杨 夕 雪 果 然 再 次 相 遇 。
可 杨 夕 雪 却 已 变 身 成 为 黑 道 大 姐 大 的 田 秋 凤 , 并 对 华 龙 飙 毫 无 印 象 , 甚 至 将 其 视 为 杀 夫 仇 人 。 一 系 列 事 情 诡 异 的 走 向 让 华 龙 飙 发 现 了 事 情 的 蹊 跷 , 他 开 始 探 查 真 相 , 终 于 查 出 这 一 切 竟 是 田 秋 凤 的 妹 妹 田 秋 雁 ( 黄 智 雯 饰 ) 所 一 手 安 排 的 !
可 摆 脱 不 了 命 运 的 华 龙 飙 再 次 意 外 害 死 田 秋 凤 , 灵 魂 重 新 回 到 了 现 代 , 为 逃 出 生 生 世 世 被 诅 咒 的 爱 情 , 华 龙 飙 决 意 找 出 转 世 施 咒 之 人 , 可 兜 兜 转 转 最 终 才 发 现 , 原 来 一 切 的 始 作 俑 者 竟 是 自 己 ......

精 彩 看 点
看 点 1 王 牌 情 侣
欧 阳 震 华 和 关 咏 荷 是 无 线 的 经 典 荧 幕 情 侣 。 两 人 于 1997年 在 《 醉 打 金 枝 》 中 首 结 ?情 侣 缘 ?, 凭 该 剧 摘 下 无 线 台 庆 颁 奖 礼 ?最 佳 惹 笑 冤 家 大 奖 ?, 此 后 两 人 在 《 美 味 天 王 》 、 《 陀 枪 师 姐 1》 和 《 陀 枪 师 姐 2》 中 数 次 组 成 ?情 侣 档 ?, 均 大 获 好 评 。 不 过 , 关 咏 荷 后 来 与 张 家 辉 结 婚 生 子 , 2009年 拍 了 《 五 味 人 生 》 后 安 心 做 全 职 妈 妈 。
在 《 情 逆 三 世 缘 》 这 部 复 出 之 作 里 , 关 咏 荷 和 欧 阳 震 华 不 再 演 ?欢 喜 冤 家 ?的 戏 码 , 而 是 改 走 ?深 沉 悲 情 ?路 线 , 以 ?穿 越 ?的 方 式 演 绎 一 段 跨 越 千 年 的 ?三 世 缘 ?。 两 人 分 别 在 三 个 时 代 分 饰 三 角 : 在 宋 代 , 欧 阳 震 华 是 包 青 天 , 关 咏 荷 是 国 师 之 妹 韩 霜 霜 , 最 终 包 青 天 无 奈 亲 手 将 女 方 斩 首 在 上 世 纪 50年 代 , 欧 阳 震 华 是 华 龙 飙 探 长 , 关 咏 荷 是 黑 帮 头 田 秋 凤 , 阴 差 阳 错 间 男 方 再 次 将 女 方 错 杀 到 了 现 代 , 欧 阳 是 情 报 科 督 察 袁 金 昌 , 关 咏 荷 是 新 闻 主 播 杨 夕 雪 , 两 人 好 不 容 易 到 了 谈 婚 论 嫁 的 阶 段 , 但 悲 剧 再 次 发 生 ??
看 点 2 穿 越 千 年
《 情 逆 三 世 缘 》 由 被 奉 为 无 线 ?穿 越 剧 鼻 祖 ?的 庄 伟 建 监 制 , 无 线 的 经 典 穿 越 剧 《 寻 秦 记 》 正 是 出 自 他 之 手 。
有 别 于 一 般 的 穿 越 剧 , 《 情 逆 三 世 缘 》 最 大 的 特 点 是 ?一 穿 再 穿 ?。 该 剧 监 制 庄 伟 建 表 示 , 之 所 以 要 穿 越 到 三 个 不 同 的 时 代 , 是 为 了 凸 显 这 段 ?千 年 情 ?, ?剧 集 的 主 题 是 ?付 出 ?, 关 咏 荷 在 三 世 里 都 死 在 最 爱 的 人 手 中 , 这 个 戏 是 在 问 : ?你 肯 为 爱 的 人 付 出 多 少 ?死 三 次 行 不 行 ?你 能 做 到 吗 ???
至 于 为 何 选 择 穿 越 在 宋 代 、 上 世 纪 50年 代 和 现 代 这 三 个 时 空 , 庄 伟 建 透 露 当 中 有 玄 机 : ?因 为 宋 代 距 离 现 在 大 约 有 一 千 多 年 , 正 好 配 合 剧 中 的 千 年 情 缘 。 ?
庄 伟 建 还 大 赞 复 出 的 关 咏 荷 表 演 更 加 成 熟 : ?关 咏 荷 的 状 态 很 好 , 保 养 得 也 很 好 , 穿 起 旗 袍 来 很 有 曲 线 。 ?他 又 表 示 虽 然 戏 里 的 爱 情 很 凄 美 , 但 欧 阳 震 华 还 是 会 大 放 笑 弹 : ?比 如 他 穿 越 回 古 代 , 会 问 古 人 那 个 ?case(案 件 )?查 成 怎 么 样 , 别 人 问 他 什 么 是 ?case?, 他 只 好 说 是 指 奇 怪 的 事 情 。 里 面 还 有 一 场 包 公 求 婚 的 戏 , 他 弹 琵 琶 求 婚 , 还 说 现 代 人 的 结 婚 誓 言 , 吓 得 关 咏 荷 不 知 怎 么 办 。 ?[4]
编 辑 本 段 相 关 新 闻
如 何 穿 越 出 新 花 样 ? 穿 1次 不 够 , 穿 3次 ! ! !
穿 越 剧 早 有 鼻 祖 , 当 年 庄 伟 健 曾 拍 下 《 寻 秦 记 》 , 被 剧 迷 封 为 T V B穿 越 剧 的 鼻 祖 , 内 地 穿 越 剧 风 起 云 涌 , 《 宫 》 (内 地 版 韩 版 )、 《 步 步 惊 心 》 (观 剧 )等 成 为 剧 迷 大 爱 , 《 情 逆 三 世 缘 》 后 浪 再 起 , 如 何 玩 出 新 花 样 ?
庄 伟 健 对 南 都 记 者 说 : ?过 往 的 穿 越 剧 多 只 拍 一 个 朝 代 , 穿 越 去 清 朝 就 只 去 清 朝 , 我 们 共 穿 越 了 三 个 年 代 : 宋 朝 、 上 世 纪 50、 60年 代 、 现 代 , 故 事 会 更 丰 富 , 拍 一 部 剧 等 于 拍 了 三 部 剧 。 ?为 什 么 选 择 宋 朝 ? ?因 为 宋 朝 距 离 现 在 的 香 港 是 一 千 年 , 所 以 有 个 ?千 年 情 ?的 概 念 在 。 欧 阳 震 华 的 角 色 是 一 个 三 世 的 执 法 者 , 在 现 代 , 他 是 一 名 香 港 的 时 装 警 察 ; 在 宋 朝 , 他 则 化 身 包 青 天 ; 到 60年 代 , 他 变 身 ?天 下 第 一 贪 ?的 贪 污 探 长 华 龙 飙 , 最 后 良 心 发 现 , 回 到 现 代 香 港 成 为 一 名 情 报 科 探 员 , 最 终 创 立 IC A C。 关 咏 荷 的 角 色 在 三 世 中 也 各 有 不 同 , 现 代 名 嘴 、 宋 朝 公 主 、 60年 代 黑 社 会 大 姐 大 , 每 个 角 色 的 性 格 都 大 相 径 庭 , 或 巴 辣 、 或 清 秀 温 婉 、 或 霸 气 十 足 , 相 当 有 看 头 。 ?
欧 阳 震 华 与 关 咏 荷 这 段 一 千 年 的 情 , 是 怎 么 穿 越 下 来 的 呢 ? 庄 伟 健 透 露 : ?如 果 你 喜 欢 一 个 人 , 你 会 为 他 付 出 所 有 , 包 括 你 的 生 命 。 欧 阳 震 华 在 剧 中 是 一 个 ?全 知 ?的 人 物 , 他 知 道 三 个 朝 代 的 所 有 事 情 , 但 每 一 个 朝 代 关 咏 荷 都 是 失 忆 的 , 什 么 都 不 知 道 。 她 就 是 希 望 包 公 可 以 回 到 现 代 , 找 回 他 喜 欢 的 女 朋 友 , 她 希 望 自 己 死 后 , 华 探 长 可 以 带 她 妹 妹 回 现 代 香 港 治 病 , 她 又 一 次 付 出 了 自 己 的 生 命 。 她 三 世 都 死 在 自 己 最 爱 的 人 手 里 。 最 后 , 在 现 代 的 香 港 时 空 , 我 们 会 解 开 这 段 宿 命 。 这 个 戏 是 在 问 你 : 你 肯 为 自 己 爱 的 人 付 出 多 少 ? 死 三 次 够 吗 ? 你 能 做 到 吗 ? ?[5]

Euro zone shares extend rally on growth data

European flag flying in front of the European Commission building in Brussels
* Euro zone exits recession, Germany, France beat GDP
forecasts
* ESTOXX 50 up nearly twice as much as S& P500 in past seven
weeks
* France's CAC 40 hits two-year high
By Blaise Robinson
PARIS, Aug 14 (Reuters) - European stocks edged higher
around midday on Wednesday as data showing the euro zone emerged
from recession in the second quarter kept a seven-week rally
alive.
Gains were capped by shares in Rio Tinto,
AstraZeneca and Royal Dutch Shell
losing their dividend entitlement.
The euro zone growth spurt was led by the German and French
economies, which both performed better than expected.
At 1020 GMT, the FTSEurofirst 300 index of top
European shares was up 0.2 percent at 1,239.63 points, gaining
ground for the fifth session in a row and extending its gains
since late June to 12 percent.
France's blue-chip CAC 40 index hit a two-year high.
Switzerland's biggest life insurer Swiss Life rose
2.5 percent after net profit jumped.
German steelmaker ThyssenKrupp fell 1.5 percent
after saying its finances weakened in the latest quarter.
STILL PLAYING CATCH-UP?
" There are signs of improvement in Europe while the region's
equities remain cheap no matter which valuation metric you use,
which is not justified anymore," said Jeanne Asseraf-Bitton,
head of global cross asset research at Lyxor Asset Management,
which has $94 billion euros under management.
" The 'great rotation' out of fixed income and into stocks is
well under way in the United States, but is just starting in
Europe, and there's good potential for a catch-up rally."
The euro zone's blue-chip Euro STOXX 50 index
was up 0.2 percent at 2,845.96 points.
The index has surged 14 percent since late June, outpacing
Wall Street's S& P 500 which is up 8.6 percent over the
same period, and is now just a few points below a peak hit in
May, above which the index would reach 2011 levels.
Tracy Knudsen, senior vice-president at technical analysis
firm Lowry Research, said there looked to be room for more
gains.
" There is a lack of evidence suggesting it has reached an
important top. The probabilities appear to favour an eventual
upside breakout above the May highs," she said, adding that a
pull-back in the short term would be a good buying opportunity.
Around Europe, France's CAC 40 was up 0.4 percent, while
Germany's DAX index was up 0.2 percent and UK's FTSE
100 index was flat, with profit-taking in the mining
sector.
The STOXX Europe 600 basic resources sector index -
which has jumped more than 10 percent in the past week following
reassuring data from China - was down 0.4 percent.
Wall Street dips modestly, but Apple extends rally

Times Square, New York
* Apple shares continue to climb after Icahn tweet
* Deere shares turn lower after results, Macy's drops
* Indexes down: Dow 0.3 pct, S& P 0.1 pct, Nasdaq 0.1 pct
By Ryan Vlastelica
NEW YORK, Aug 14 (Reuters) - U.S. stocks were slightly lower on Wednesday as investors found few reasons to make big bets, with equities near all-time highs and little clarity over Federal Reserve policy.
Apple Inc was one of the biggest gainers of the day, rising 1.7 percent to $498.28 to extend a rally that began Tuesday after activist investor Carl Icahn tweeted that he had built a " large position" in the tech company. However, those gains didn't translate to a broader advance.
Wall Street has struggled for direction recently, with the S& P 500 trading in a narrow range over the past month. During that period, the index has only closed once with a move greater than 1 percent.
Trading volume has been among the lowest of the year, as earnings season winds down and economic indicators present a mixed view of economic growth. Currently, the S& P is less than 1 percent away from its all-time high.
On Tuesday, Atlanta Fed President Dennis Lockhart said the U.S. central bank could begin to slow its quantitative easing (QE) stimulus as early as next month, though data has been too mixed to outline a detailed exit strategy.
" Investors are still trying to assess the Fed and what it will do next, leaving us to bounce around on a daily basis but essentially go nowhere," said Paul Nolte, managing director at Dearborn Partners in Chicago. " Things should be quiet until we get more clarity on that end.
Equities have been tethered to Fed policy for much of the year, and many investors are worried that economic growth may lose momentum without the Fed's bond-buying intervention. Many traders are awaiting clarity on when the program could begin to slow before adjusting positions.
Producer prices were flat in July, below expectations for a 0.3 percent increase. The data could add to worries at the Fed that inflation is too low, but stocks were little impacted by the news.
The Dow Jones industrial average was down 50.10 points, or 0.32 percent, at 15,400.91. The Standard & Poor's 500 Index was down 2.14 points, or 0.13 percent, at 1,692.02. The Nasdaq Composite Index was down 3.79 points, or 0.10 percent, at 3,680.66.
Stocks have trended lower recently, with the S& P down for five of the past seven sessions. For the year, it remains up almost 19 percent.
Cisco Systems weighed on the Dow, falling 1 percent to $26.06. The company is scheduled to report its quarterly results after the market closes.
Deere & Co fell 1.3 percent to $82.92, even as its third-quarter earnings and sales beat expectations. The stock had advanced in premarket trading.
Shares of Macy's Inc fell 3.8 percent to $46.65 after the company reported its results and cut its full-year profit outlook.
Steinway Musical Instruments Inc jumped 5.6 percent to $40.43 after it agreed to be taken private by Paulson & Co for $40 a share.
Goodyear Tire & Rubber Co rose 1.7 percent to $19.54 a day after the company said one of its largest investors had raised its stake in the company by 44 percent.
European shares rose 0.4 percent, extending a seven-week rally after data showed France pulled out of recession in the second quarter, while Germany posted its largest expansion in more than a year.
Singapore lose 2-0 to Oman in Asian Cup qualifier

Singapore National Football Team coach Bernd Stange during training. Photo by Wee Teck Hian, 28 May 2013.
Lions still winless and goalless after their first two Group A matches
By Hiranand Sunny
SINGAPORE ? Singapore?s first international match under new coach Bernd Stange ended in defeat today (Aug 14) after they lost 2-0 to Oman in an Asian Cup qualifier at the Jalan Besar Stadium.
The Lions started the game well and treated the Jalan Besar crowd to a good display of Stange?s passing brand of football. But Oman took the lead in the 15th minute after a neat attacking move resulted in a shot being placed beyond the reach of LionsXII goalkeeper Izwan Mahbud.
Qiu Li had a golden opportunity to level the scores in the 29th minute but his free-kick on the edge of the area went inches wide.
That miss proved to be costly as Oman doubled their lead on the stroke of half-time with a perfectly-placed shot from long range.
The visitors dominated proceedings in a dull second half and had several more opportunities to extend their lead. Fortunately for the Lions, the visitors were denied by a combination of poor finishing and good defending.
The biggest cheers of the night were reserved for 17-year-old striker Adam Swandi, who came on just before the hour mark to replace Balestier Khalsa forward Qiu Li.
Singapore have now lost both their Group A encounters and have yet to score a goal. Their next Asian Cup qualifier will be against Syria at the Jalan Besar Stadium on Oct 15.
Doji candlestick patterns
Before reading this lesson you should have previously read through:
appear when the prices of an are virtually the same. They can therefore be recognised by their much shorter body than typical .
Doji candlesticks occur when the opening and closing price of an asset are roughly the same. They indicate that markets are indecisive.
They indicate that is indecisive, with a relatively even balance of (buyers) and (sellers) unable to push decisively in one . Depending on their type, they can help you recognise when a price move or may be slowing down and when a price might course.
This can help you exit a trade before a trend is coming to an end or enter into a new trend as it starts.
Stars, long legs, gravestones and dragonflies
The names of the four doji candlesticks ? star, long legged, gravestone and dragonfly ? describe their shape.
There are four types of doji candlestick:
- Standard or 'star' doji
- Long legged doji
- Gravestone doji
- Dragonfly doji
Their names describe their appearance, as shown on the diagrams below.
They are all similar in that the opening and closing prices are the same. However, the position and length of the candlestick's wicks are different for each.
Star doji
The standard doji candlestick, seen to the right, has two short wicks that are of a similar length both up and down. It appears when the candle has opened and closed at the same level and has moved in a very small range in between.
It indicates extreme indecision in the market and a lack of commitment from traders. If other suggest that prices are or , it can mean a price reversal is imminent.
Long legged doji
The long legged doji, seen to the right, has long upper and lower wicks and appears when the price has moved up and down dramatically before the candle closed at the same level as it opened.
It also indicates indecision between bulls and bears but suggests that are becoming more active and that a volatile price move may soon occur.
Gravestone doji
The gravestone doji, seen to the right, has a long upper wick and appears when a candle's open and close occur at the low end of its trading range.
It indicates that a current may be coming to an end with the price about to reverse downward.
Dragonfly doji
The dragonfly doji, seen to the right, has a long lower wick and appears when a candle's open and close occur at the high end of its trading range.
It indicates that a current may be coming to an end with the price about to reverse upwards.
Best in trending markets
Doji candlesticks are best used in trending markets. They can be unreliable in ranging markets.
Because they alert you to the slowdown in a price move or a possible reversal, doji candlestick patterns work best when markets are trending.
They can be unreliable in markets. This is because markets are naturally full of indecision during these times and price moves are small, making it harder to recognise when a doji candlestick is giving a valid signal by appearing.
You can apply what you have learnt about the different types of Doji's in the exercises below:
Exercise 1: Where is the Doji pattern in the following chart? Show exercise
Using what you have learnt about Doji patterns where on the chart is the Doji?
 Solution
Using what you have learnt about Doji patterns where on the chart is the Doji?
Show solution
In the shaded area at the dragonfly doji forms. Notice how the price reverses from a downtrend into an uptrend after the doji is formed.

In the shaded area at
the dragonfly doji forms. Notice how the price reverses from a downtrend into an uptrend after the doji is formed.
Exercise 2: Where is the Doji pattern in the following chart? Show exercise
Using what you have learnt about Doji patterns where on the chart is the Doji?
 Solution
Using what you have learnt about Doji patterns where on the chart is the Doji?
Show solution
In the shaded area at the long legged doji star forms. Notice how the price reverses from a downtrend into an uptrend after the doji is formed.

In the shaded area at
the long legged doji star forms. Notice how the price reverses from a downtrend into an uptrend after the doji is formed.
Exercise 3: What is the doji pattern telling you? Show exercise
The doji in is a star doji. What is this potentially telling us with regard to the price?
 Solution
The doji in
is a star doji. What is this potentially telling us with regard to the price?
Show solution
You can see from the chart that as the star doji forms at the price begins to reverse before moving lower, shown in  .
.

You can see from the chart that as the star doji forms at
the price begins to reverse before moving lower, shown in .
Exercise 4: What is the doji pattern telling you? Show exercise
The doji in is a gravestone doji. What is this potentially telling us with regard to the price?
 Solution
The doji in
is a gravestone doji. What is this potentially telling us with regard to the price?
Show solution
You can see from the chart that as the gravestone doji forms at the price begins to reverse before moving lower, shown in .

You can see from the chart that as the gravestone doji forms at
the price begins to reverse before moving lower, shown in .
Summary
In this lesson you have learned ?
- ? doji candlestick patterns occur when the opening and closing prices of an asset are the same.
- ? they indicate that markets are indecisive, with a relatively even balance of bulls and bears.
- ? there are four types of doji candlestick, which can help you recognise when a price move or trend may be slowing down and when a reversal might occur.
- ? they can help you exit a trade before a price move ends and jump on a new trend as it starts.
- ? the standard or star doji candlestick has two short wicks that are of a similar length above and below. It indicates extreme indecision and in overbought or oversold markets it can predict a price reversal if other indicators confirm this.
- ? the long legged doji has long upper and lower wicks. It indicates indecision but suggests that traders are becoming more active and that a volatile price move may occur soon.
- ? the gravestone doji has a long upper wick. It indicates that a current uptrend may be ending and a downward reversal is about to occur.
- ? the dragonfly doji has a long lower wick. It indicates that a current downtrend may be ending and an upward reversal about to occur.
- ? doji candlesticks are best used in trending markets and can be unreliable in ranging markets.
click for solution: http://en.tradimo.com/learn/candlesticks/doji-candlestick-pattern/
Trend Lines
A trend line (shortened to " trendline" elsewhere on this website) is simply a momentum indicator. It measures the rate of increase in the share price over time and alerts you to any acceleration or deceleration of the trend. The difference between trendlines and other momentum indicators is that you use a super-computer (the human brain) to visually identify the trend, rather than a simplistic formula calculated on your PC.
Trend Line Basics
- Draw trendlines through the lows of an up-trend ? and through the highs of a down-trend
- On long-term charts, draw trendlines through closing prices
- Use either normal or log scale charts but be aware of their respective weaknesses
- Trendlines must be respected by at least three lows (or highs in a down-trend) ? if respected twice, the trendline is not yet confirmed
- Trendlines should not intersect (cut across) price at any point on the chart if extended.
Support and Resistance
Trendlines do not predict levels of support and resistance. Support and resistance run horizontally not at an angle. For an explanation of the basics, see Support and Resistance. Many traders confuse the two concepts: the lower line in a trend channel is often referred to as the supporting trendline.
Highs or Lows
On a short-term chart (6 months or less), draw trendlines through the lows during an up-trend.

And through highs during a down-trend.
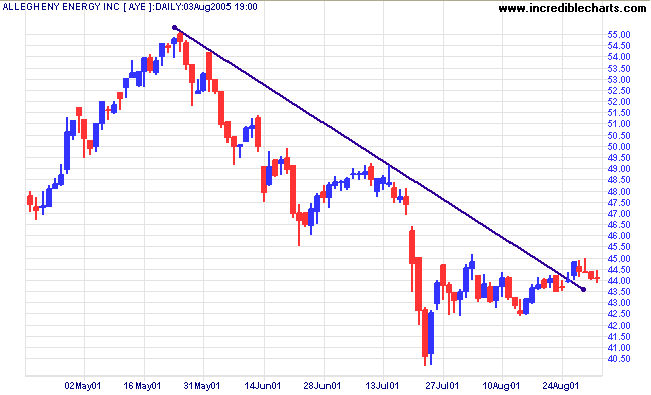
Closing Price
On a long-term chart, trendlines drawn with closing price are more effective.

The lower trendline was drawn according to daily lows, to illustrate this point.
Log or Normal Scale?
There has been much debate on the Chart Forum over the years as to whether trendlines should be drawn on log scale or normal scale charts.
The case for log scale has been summarized by Alsoran as:
- Brokers and analysts chart in log mode. They advise institutional clients whose order flow has a marked impact on price action and trend. Their advice is heavily influenced by breaks and refusals of price at key trendlines and channels. These are based on logarithmic charts. Logarithmic trendlines are, therefore, more important.
The case for normal scale (linear) trendlines:
- Most trading authors use linear charts: Stan Weinstein, Alexander Elder, Chris Tate and Daryl Guppy.
- It is questionable whether most analysts and brokers use log scale charts. Many trading authors (including Stan Weinstein and Chris Tate) are former analysts or brokers and use linear charts.
In my opinion the two sides are talking about different time frames!
Normal Scale
Normal scale charts compare price against time. You would graph the speed of a car in a similar manner: distance (y) over time (x). If a car travels at a constant velocity, the graph will be a straight line. If stopped, the line will be horizontal. If accelerating, the graph will show a curve.
Log Scale
Log charts are not designed to measure velocity, they measure acceleration: the rate of growth in stock prices. A constant velocity will be depicted as a flattening curve a constant rate of growth (acceleration) will be depicted as a straight line.
Short Term
In the short/medium term we focus on velocity: " Is this week's price increase as good as last week?" The time period is too short to be concerned with compound growth rates.
Long Term
Most institutions hold stocks for the long-term and do not concern themselves with short-term fluctuations. They want to know the annual compound growth rate a very different concept from short-term velocity.
What Chart Scale Should I Use?
- On short-term and medium-term charts (3 years or less) we recommend that you use normal scale.
- For long-term charts (more than 3 years), use either normal scale (linear) or log charts, but be aware of their respective strengths and weaknesses. Personally, I prefer to draw trendlines on linear charts unless we are looking at a 10 or 20 year time period.
Support and Resistance
Support and resistance form the foundation of most chart patterns.
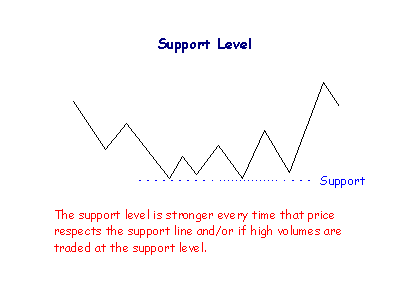
Support
A support level is the price at which buyers are expected to enter the market in sufficient numbers to take control from sellers.
The market has a memory. When price falls to a new Low and then rallies, buyers who missed out on the first trough will be inclined to buy if price returns to that level. Afraid of missing out for a second time, they may enter the market in sufficient numbers to take control from sellers. The result is a rally, reinforcing perceptions that price is unlikely to fall further and creating a support level.
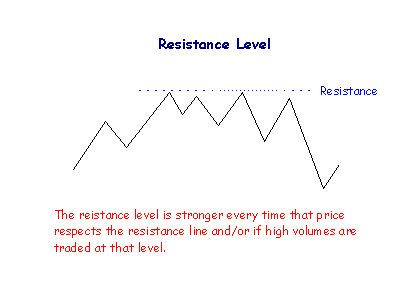
Resistance
A resistance level is the price level at which sellers are expected to enter the market in sufficient numbers to take control from buyers.
When price makes a new High and then retreats, sellers who missed the previous peak will be inclined to sell when price returns to that level. Afraid of missing out a second time, they may enter the market in numbers sufficient to overwhelm buyers. The resulting correction will reinforce market perceptions that price is unlikely to move higher and establish a resistance level.
Point and figure charts are useful for identifying support and resistance levels.
Role Reversal
Support levels, once penetrated, frequently become resistance levels and vice versa.
The market logic is fairly simple: buyers who purchase near a support level, only to see price fall, are likely to sell in order to recover their losses, when price rallies to near their break-even point. The support level then becomes a resistance level.

Likewise, stockholders who sell when price approaches a resistance level will be disappointed if price penetrates the level and continues to rise. They will be inclined to buy if price returns to near the support level, fearing that they may miss out a second time. The resistance level thus becomes entrenched as a support level.
Strength of Support/Resistance
Some support and resistance levels are more important than others. The significance of the support level is identifiable by:
- the number of times that the level has been respected
- the amount of volume that has been traded near the level
- whether the level is old or new - recent levels have greater significance
- whether the level is a new High or new Low - more extreme levels have greater impact or
- a level formed at a round number (e.g. $20.00 or $100.00) leaves a lasting imprint.
Gaps
Gaps occur when the lowest price traded is above the high of the previous day or, conversely, when the highest price traded is below the previous day's low.

A gap is filled when the range of subsequent bars closes the gap.

There are two basic rules:
- Avoid trading common gaps, and
- Only trade gaps when they are confirmed by volume.
Equivolume charts highlight the interaction of price and volume.
Common Gaps

Common gaps occur in markets without a strong trend. They are not followed by new highs or new lows and are quickly closed in subsequent days' trading.
Some gaps are caused by events and should be ignored:
- Ex-dividend gaps occur as price adjusts on the day after a dividend becomes payable
- New share issues and
- Expiry of futures contracts.
Breakaway Gaps

Breakaway gaps are normally accompanied by heavy volume and occur when prices break out of a trading range. They are usually followed by a series of new highs in an upside breakout or, a series of new lows in a downside breakout, and are seldom closed.
Trading Rules
Upside Breakaway
If the gap is accompanied by heavy volume, go long and place a stop-loss at the lower end of the gap.
Downside Breakaway
If the gap is accompanied by heavy volume, go short and place a stop-loss at the upper end of the gap.
Continuation Gaps

Continuation gaps occur near the middle of strong trends and are useful in projecting how far the trend will continue. They are followed by new highs in an up-trend or new lows in a down-trend, which distinguishes them from exhaustion gaps. They are not normally closed.
Trading Rules
If volume is strong (up at least 50%), trade as for breakaway gaps. Enter the trade early and wait for new highs (or new lows in a down-trend) to confirm the pattern. If there are none in the next few days then exit immediately ? it could be an exhaustion gap.
Exhaustion Gaps

Exhaustion gaps occur at the end of a strong trend and are the last surge before the trend expires, normally on heavy volume. They differ from continuation gaps in that they are not followed by new highs (in an up-trend) or new lows (in a down-trend) and are closed shortly afterwards.
Trading Rules
Upward Exhaustion Gap
Sell short (or close your long position) and protect yourself with a stop above the last high.
Downward Exhaustion Gap
Go long (or close your short position) with a stop below the latest low point.
Island Clusters

Look out for island clusters, identified by an exhaustion gap followed (after a few days) by a breakaway gap in the opposite direction, they are powerful reversal signals.
Trading Rules
Trade in the same way as exhaustion gaps.
China shares have first loss in four days, materials weak

Welcome to Shanghai sign at night
The CSI300 of the leading Shanghai and Shenzhen A-share listings ended down 0.4 percent at 2,349.1 points, while the Shanghai Composite Index edged down 0.3 percent. Both had tested fresh eight-week highs earlier in the day.
(Reporting by Clement Tan Editing by Richard Borsuk)
Head and Shoulders Patterns
Head and Shoulders
A head and shoulders pattern consists of a peak followed by a higher peak and then a lower peak with a break below the neckline. The neckline is drawn through the lowest points of the two intervening troughs and may slope upward or downward. A downward sloping neckline is more reliable as a signal.
The extent of the breakout move can be estimated by measuring from the top of the middle peak down to the neckline. This target is then projected downwards from the point of breakout.

Volume Confirmation
-
High volume on the first peak, -
Moderate volume on the middle peak, -
Low volume on the third peak, and -
A sharp increase in volume on the break below the neckline.
Trading Signals
Go short at breakout below the neckline.
Place a stop-loss just above the last peak.
After the breakout, price often rallies back to the neckline which then acts as a resistance level. Go short on a reversal signal and place a stop-loss one tick above the resistance level.

Never trust a head and shoulders pattern where the neckline is clearly ascending (the second trough being higher than the first). Also, the more level the neckline, the more reliable the pattern.
Inverted Head and Shoulders
With inverted head and shoulders the neckline is drawn through the highest points of the two intervening peaks. A downward sloping neckline signals continuing weakness and is less reliable as a reversal signal.
The extent of the breakout move can be estimated by measuring from the top of the middle trough up to the neckline. This target is then projected upwards from the point of breakout.

Volume Confirmation
-
High volume on the first trough, -
Moderate volume on the second trough, -
High volume on the second peak, -
Low volume on the third trough, and -
A sharp increase in volume at the breakout.
Trading Signals
Go long at breakout above the neckline.
Place a stop-loss one tick below the last trough.
There is frequently a correction back to the neckline, which then acts as a support level. Go long on a reversal signal and place a stop-loss one tick below the support level.

Never trust an inverted head and shoulders pattern where the neckline is clearly descending (the second peak being lower than the first). The more level the neckline, the more reliable the pattern.